


Bitcoin's rise above $63,000 signals potential rallies in altcoins like APT, WIF, and FTM. With decreasing exchange-held Bitcoin and the Fed's potential rate cut, the crypto market could see further bullish movement. Explore the key technical patterns driving these markets.
The crypto market showed improving sentiments today as major coins experienced price increases. The Crypto Fear & Greed Index decreased from 61 last week to 50 today, signaling a slight improvement but still lingering in the 'Neutral' zone. Bitcoin (BTC) remains volatile this week, but showing clear signs of rally potential.
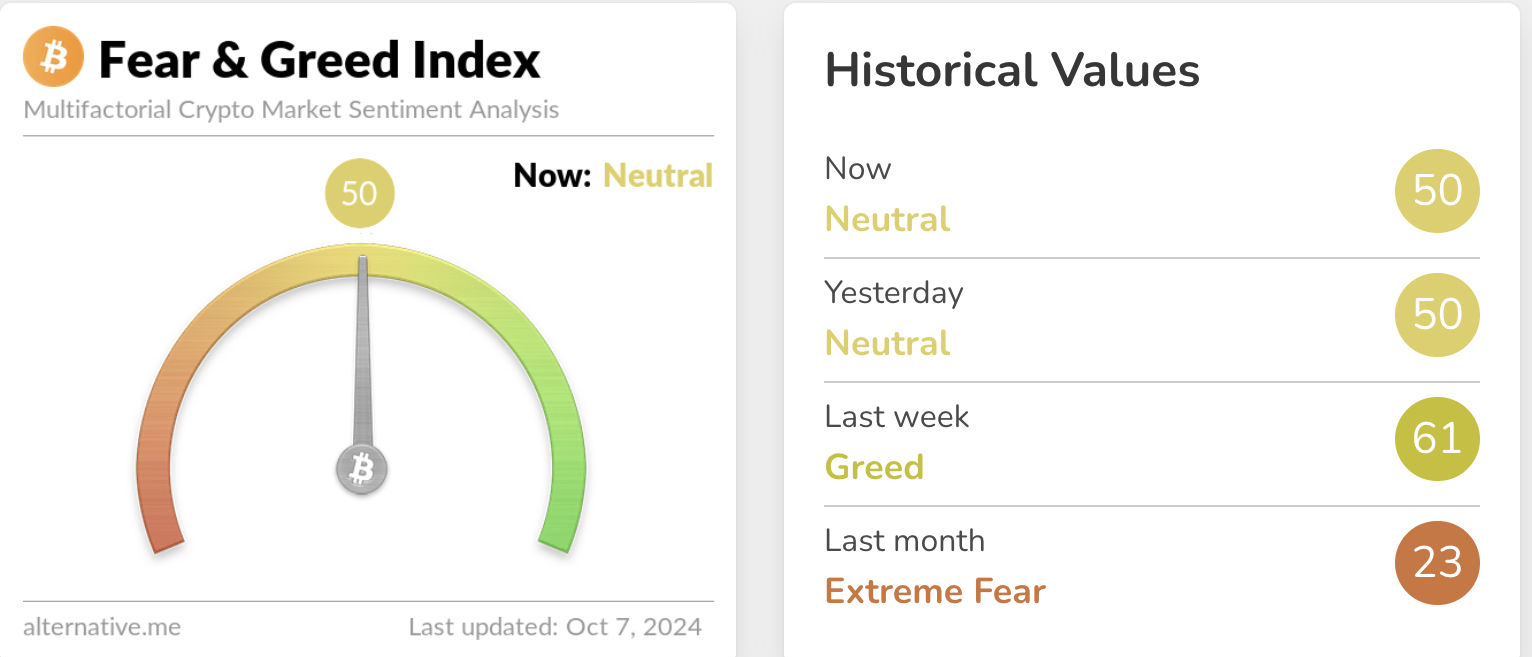
Crypto fear and greed index | Source: Alternative.me
Trending Tokens of the Day
Top 24-Hour Performers
|
|
Trading Pair |
24H Change |
|
⬆️ |
+43.45% |
|
|
⬆️ |
+42.02% |
|
|
⬆️ |
+31.43% |
Last Friday's U.S. non-farm payrolls report for September showed the strongest job growth in six months, with the unemployment rate unexpectedly declining. This shifted market expectations away from a significant interest rate cut in November. U.S. stocks closed higher on Friday, and Asia-Pacific markets opened positively. Bitcoin surpassed $63,000, while the ETH/BTC exchange rate held steady around 0.039, reflecting optimism for a soft economic landing.
Currently, market narratives are centered on AI, meme coins, and popular public blockchains. Among these, the public chain SUI (+9%), AI-related TAO (+16%), and meme coin NEIRO (+47%) are attracting the most attention. Notably, Sui's on-chain activity reached its second-highest level in history this week. There's also a growing trend of on-chain meme coins, with the hippo-themed HIPPO leading the pack.
This market overview highlights the interconnected nature of traditional finance, cryptocurrency markets, and emerging blockchain trends, showcasing how economic data can influence various sectors of the digital asset space.
Read more: Sui Price Prediction: Can SUI Touch New ATH as TVL Crosses $1 Billion?
Quick Market Updates
1. Price (UTC+8 8:00) BTC:$63,464,+2.41%; ETH:$2,488,+2.95%
2. 24 hours long/short: 52.2%/47.8%
3. Yesterday's Fear & Greed Index: 50 (50 24 hours ago), with a neutral rating
Industry Highlights for October 7, 2024
-
Trump's probability of being elected president rises to 50.8% on Polymarket, Harris drops to 48.4%
-
Vitalik Buterin donated 100 ETH to Roman Storm Legal Defense Fund
-
Tether launches a 10th anniversary documentary about USDT and its impact on the fight against inflation
-
Fractal Bitcoin released its Q4 roadmap to launch a trustless CAT20 marketplace and activate Runes
-
Crypto companies raised $823 million in September 2024
Bitcoin Price Analysis: Rally Toward $66,500?
Bitcoin has recently reclaimed the $62,000 price level, showing signs of a continued uptrend. After testing the 50-day Simple Moving Average at $60,589 on October 4, Bitcoin rebounded sharply, indicating that buyers are actively defending key support zones.
If the bullish momentum persists and the price remains above the 20-day Exponential Moving Average, Bitcoin could potentially rise toward the next resistance at $66,500. This level could attract selling pressure; however, a sustained breakout above $66,500 would open the path to a rally toward the $70,000 psychological barrier.

Crypto market data daily view October 6, 2024 Source: Coin360
On the downside, if Bitcoin fails to hold above the 50-day SMA, the price could decline to the $57,500 support level, with the next major support at $54,000. In the 4-hour chart, the price remains above the 20-EMA, suggesting a shift in momentum to the bulls. A close above the 50-SMA would likely increase the probability of a rally toward $65,000.
Failure to hold above the 20-EMA could indicate a short-term reversal, potentially bringing the price back down to $60,000. A break of this level would suggest deeper correction toward $57,500 or even $54,000.
Read more: Bitcoin Market Holds Strong Amid $60K Threat: Traders Remain Optimistic

BTC/USDT daily chart. Source: TradingView
Read More: Bitcoin Could Rally to $90,000 If Trump Wins the US Election: Bernstein
Aptos (APT) Price Analysis: Inverted Head-and-Shoulders Breakout
Aptos recently broke out from an inverted head-and-shoulders pattern on September 21. The breakout was confirmed on October 2 when Aptos successfully retested the $7.65 level. The 20-day EMA has turned upwards, and the Relative Strength Index is in positive territory, indicating bullish control.
Aptos is currently poised to reach the pattern's technical target of $11. However, the continuation of this bullish trend depends on the price remaining above the 20-EMA on the 4-hour chart. If it breaks above $9.32, it would confirm the uptrend and signal further gains.
On the downside, a break below the $7.65 support level would invalidate the breakout and signal a potential decline toward $5.66. The bulls need to hold the 20-EMA to prevent profit-taking by early buyers. A failure to do so could lead to a decline to the 50-SMA.

APT/USDT daily chart. Source: TradingView
Dogwifhat (WIF) Price Analysis: Bullish Ascending Triangle Pattern
Dogwifhat has been trading within an ascending triangle pattern, signaling a potential bullish continuation. The price has remained above the 20-day EMA at $2.09, with both moving averages sloping upward. The RSI is in positive territory, suggesting that bulls currently have the upper hand.
A decisive breakout above the downtrend line could lead to a rally toward the $2.64 to $2.89 resistance zone. If bulls push through this zone, Dogwifhat could target the next major resistance level at $3.50.
On the other hand, a break below the 20-day EMA would indicate a weakening bullish sentiment and potentially pull the price down to the 50-day SMA at $1.77. On the 4-hour chart, it is currently holding at the breakout level of $2. The ascending triangle pattern has a target objective of $2.93, with a rally to $2.60 being immediate.
If it breaks below $2, it could invalidate this bullish pattern and lead to a drop to its uptrend line.
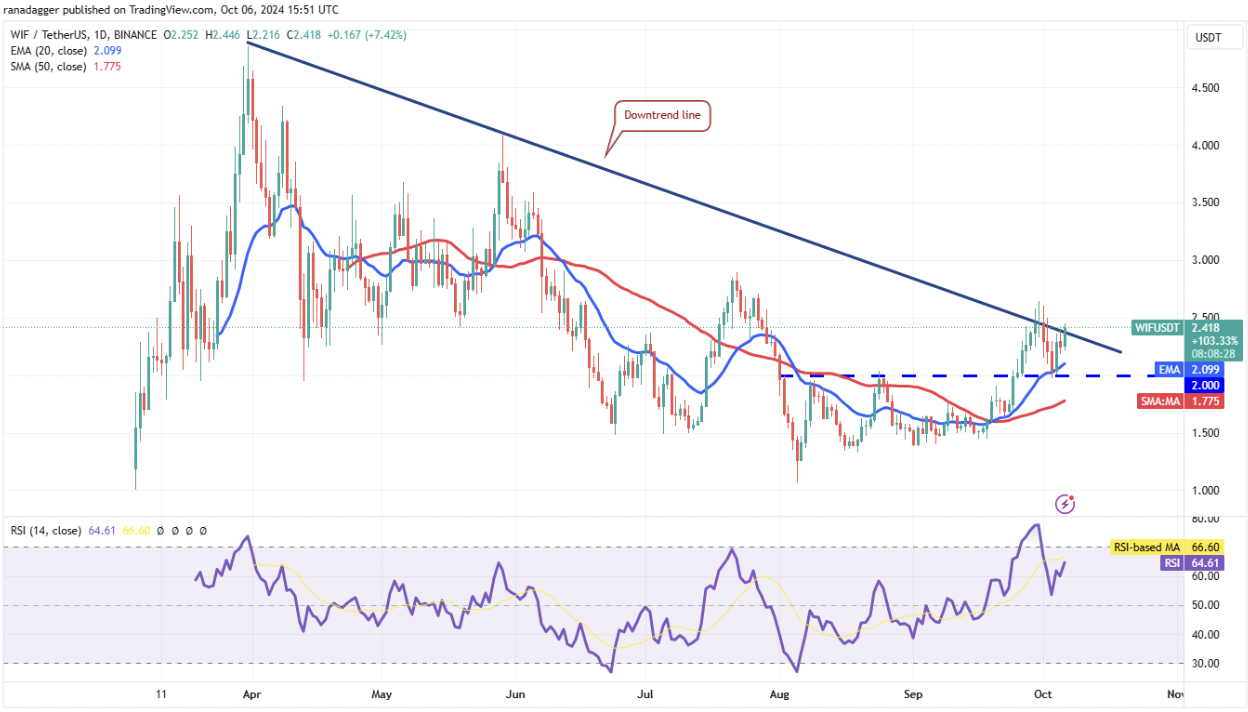
WIF/USDT daily chart. Source: TradingView
Fantom (FTM) Price Analysis: Inverse Head-and-Shoulders in Play
Fantom completed an inverse head-and-shoulders pattern on September 17 by breaking above the $0.55 resistance level. Typically after such a breakout, prices retest this level; Fantom is currently holding support at the 20-day EMA at $0.62.
If it can rebound and break through resistance at $0.70, Fantom could rally toward its technical target of $0.83 with further potential to reach $0.93 if momentum sustains.
However, if Fantom breaks below $0.55, it would invalidate this bullish breakout and signal a potential trend reversal. Bulls need to defend around $0.58 to form a local bottom; breaking above the 50-SMA would confirm buying interest and set up for a rally to $0.76 with a next target at $0.83.
In contrast, failing to maintain these support levels would signal renewed bearish pressure and potentially drive prices down to or below $0.55.
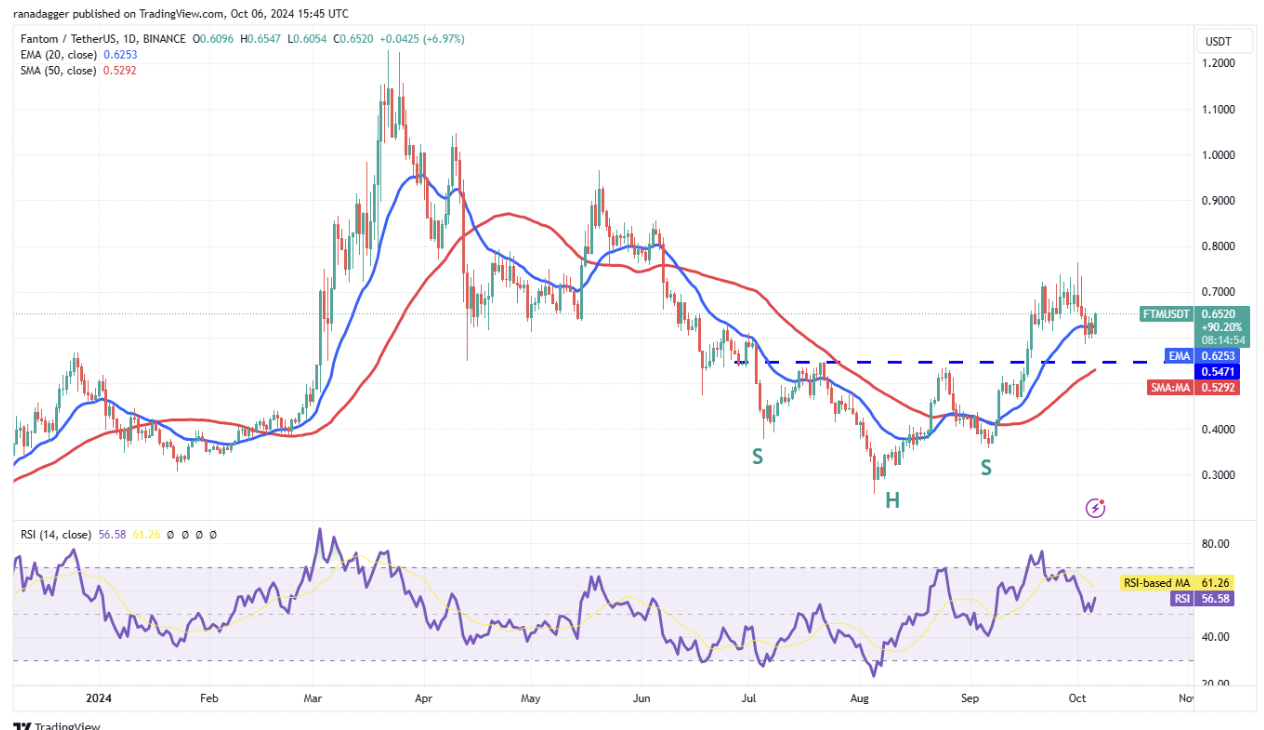
FTM/USDT daily chart. Source: TradingView
Market Outlook: Key Catalysts for Bitcoin and Altcoins
Bitcoin's rise above $62,000 is occurring against macroeconomic factors that are favorable for risk assets. The expected rate cut by central banks is boosting risk-on sentiment in financial markets while decreasing amounts of Bitcoin held on centralized exchanges indicate a supply squeeze that could further fuel its price action.
For altcoins like Aptos, Dogwifhat, and Fantom, bullish technical patterns suggest potential rallies in the near term; however much will depend on broader market sentiment and Bitcoin's ability to maintain its current upward trajectory.
Investors should closely watch support levels and moving averages to assess potential reversals or continuations in this uptrend as volatility remains high in crypto markets but technical indicators currently favor bullish action.
Key factors Driving Bitcoin's Current Rally
-
Monetary Policy Expectations: There is growing sentiment that central banks, particularly the Federal Reserve, may be done with interest rate hikes and could potentially cut rates soon. This expectation of looser monetary policy tends to boost riskier assets like Bitcoin.
-
AI-Driven Demand: Some analysts predict that Bitcoin miners accommodating data demands for artificial intelligence could help support Bitcoin's price by providing an alternative revenue stream.
-
Geopolitical Factors: The increasing likelihood of a second Trump presidency is seen as potentially bullish for Bitcoin, given a more crypto-friendly stance compared to previous terms.
-
Technical Factors: Bitcoin has broken through key resistance levels, which often triggers further buying momentum.
-
Seasonal Trends: Historically, October and November have been strong months for Bitcoin performance, which may be influencing investor sentiment.
Read more: Crypto Inflows Surge: $1.2 Billion in a Week Amid Rate Cut Hopes
Conclusion
In conclusion, the cryptocurrency market is showing signs of bullish momentum as Bitcoin breaks the $62,000 level. This surge is driven by several factors, including favorable macroeconomic conditions, anticipated regulatory approvals, and technical breakouts in various altcoins. The potential for further Federal Reserve rate cuts and decreasing Bitcoin holdings on centralized exchanges are contributing to a positive market outlook.
As the crypto market continues to experience volatility, it's crucial for traders to stay informed and utilize advanced trading tools and strategies. Whether you're a seasoned trader or just starting out, understanding different order types and market dynamics can greatly enhance your trading experience. Read more on KuCoin or trade on KuCoin now to explore the exciting world of cryptocurrency trading and stay ahead in this dynamic market. Stay tuned to KuCoin News for more crypto market updates and insights.
Read More: Crypto Daily Movers, October 4: Mixed Sentiments as Market Awaits US Payroll Data


