


Jupiter (JUP), a decentralized exchange (DEX) aggregator on the Solana blockchain, has been showing significant bullish signs. The token has traded within the upper half of the Bollinger Bands for nearly ten days, reinforcing the bullish bias.
Quick Take
-
Jupiter has consistently traded in the upper half of the Bollinger Bands for nearly ten days.
-
The $1 level has flipped to support, while $1.2-$1.3 is the next resistance.
-
Despite the bullish trend, trading volume remains relatively low.
-
Potential targets include $1.4, $1.6, and the all-time high of $1.85.
-
RSI at 46.60 and Stochastic at 20.36 suggest room for growth.
Jupiter has become one of the top DEX aggregators in the Solana ecosystem in a short amount of time. The $JUP price bounced beautifully from the 0.618 Fibonacci level multiple times before breaking through the downward trend line to reach just over $1. The daily close for $JUP will be crucial to determine if resistance can now be flipped into support at the $1 level.
Read more: Top Decentralized Exchanges (DEXs) in the Solana Ecosystem to Watch in 2024
Measured from July 8th, JUP has rallied an impressive 65%. This surge flipped the $1 area to support, which might be tested again in the near-term. The market structure turned bullish after the $0.8 resistance was breached. However, considering the wild volatility on July 4th, a more conservative view might indicate that the structure remains bearish.
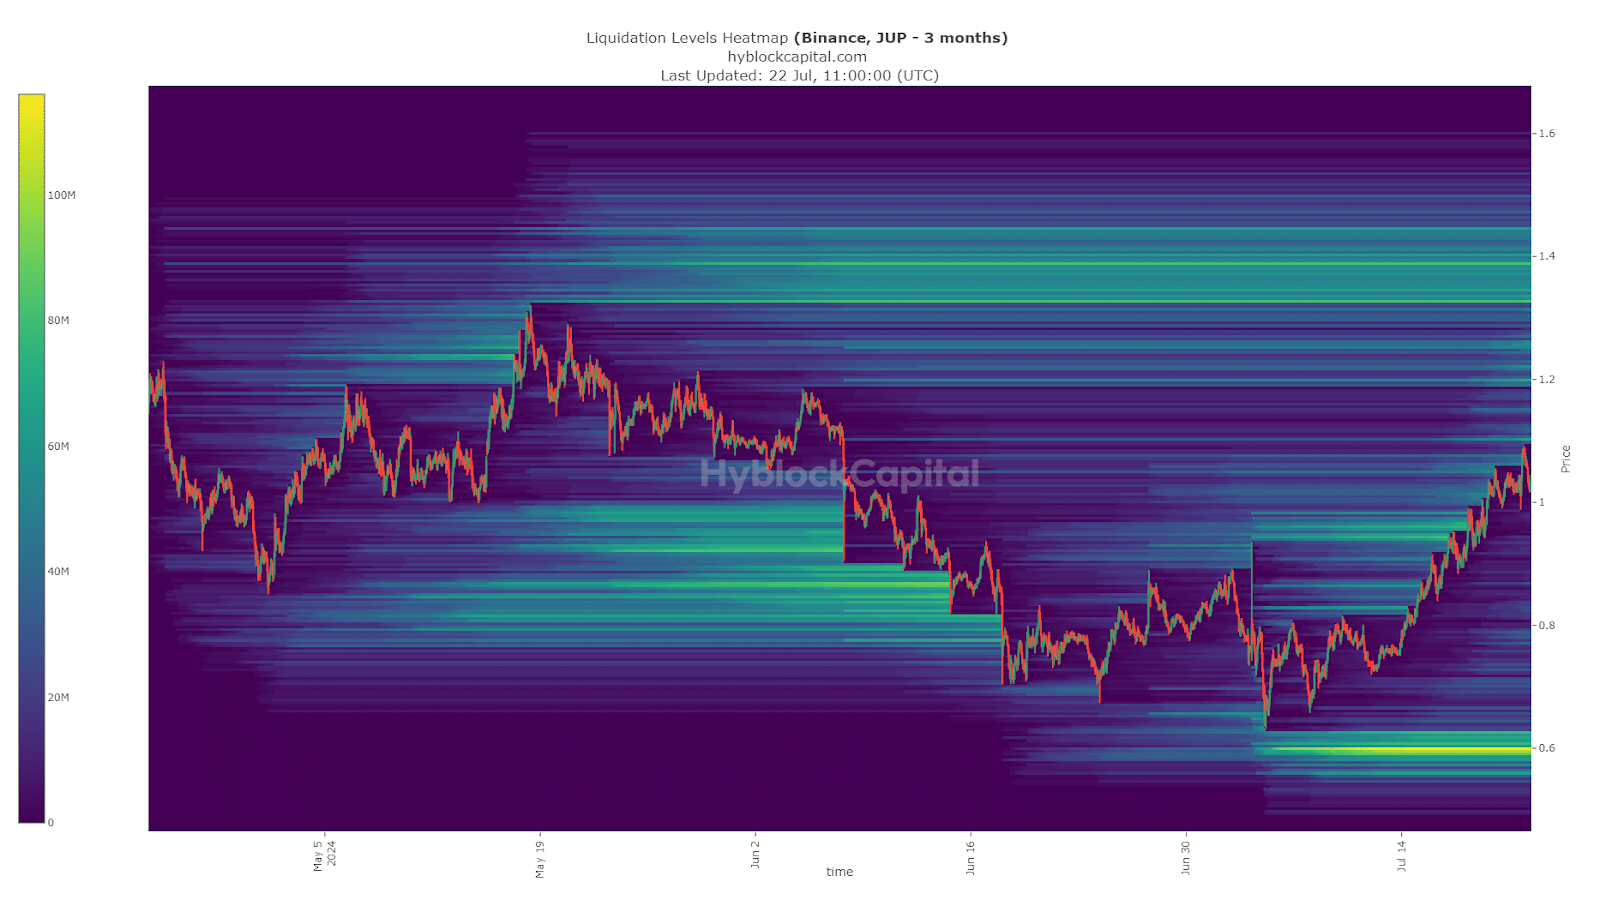
Jupiter (JUP) liquidity analysis | Source: Hyblock
The $1 level was breached, with the liquidity cluster at $0.95-$0.98 taken out effortlessly. To the north, the $1.2 and $1.4 levels are the next targets, aligning well with the bearish order block target from the price chart. Short-term liquidation levels show a skew toward long positions, setting up conditions for a potential long squeeze. If this happens, the $0.97-$0.98 region is expected to serve as support.
JUP Faces Key Resistance Around $1.20-$1.30
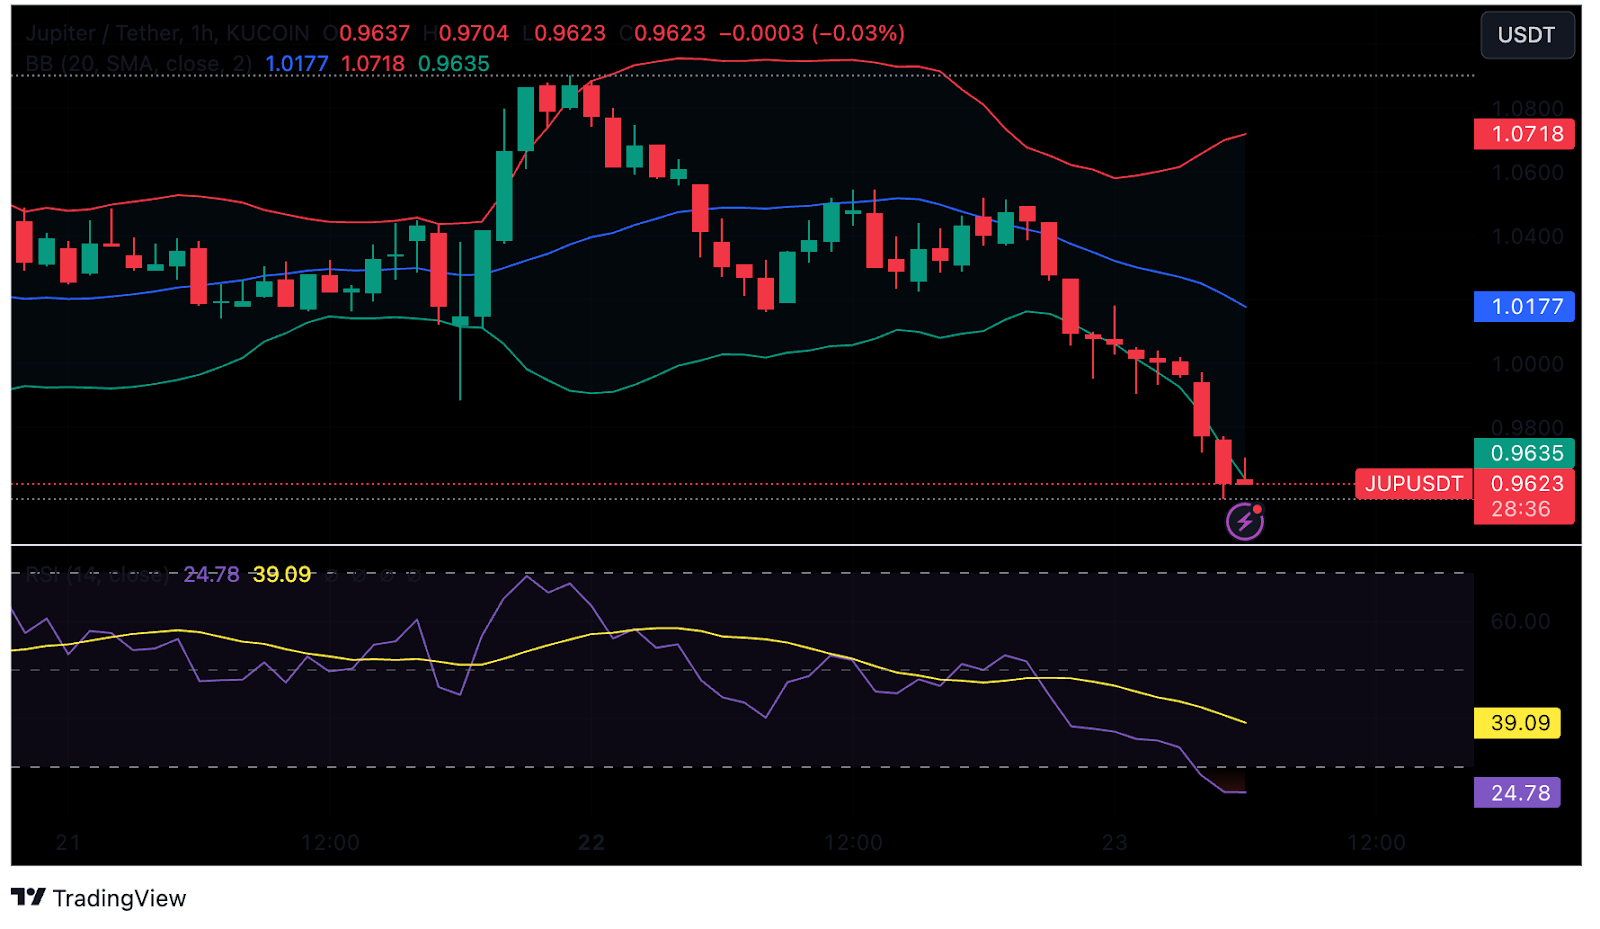
JUP/USDT price chart | Source: TradingView
The H12 bearish order block at the $1.2-$1.3 zone is the next key resistance. This area has served as resistance since mid-April. The indicators remain firmly bullish, suggesting the rally could extend past $1. However, the relatively low trading volume compared to February and March is a worrying factor, indicating that bullish sentiment might not be as widespread as price action suggests.
Will Jupiter Test $1.85 ATH?
The primary targets for $JUP are $1.4, $1.6, and the all-time high of $1.85. If $JUP can enter price discovery, further targets of $2.6 and $3.8 could be achievable.
With a price range between $0.90 and $1.18, JUP shows promise despite recent market dips. Bulls are testing the nearest resistance level at $1.27, with strong support at $0.72. The 10-day moving average is $1.04, and the 100-day average is $1.01, indicating resilience. An RSI of 46.60 and a Stochastic of 20.36 suggest that JUP is not overbought yet. The recent uptick of 26% in one week and a massive 3345% rise in six months indicate strong upward momentum.
Conclusion
Jupiter (JUP) presents a compelling case for bullish growth, supported by technical indicators and market structure. While low trading volume poses a concern, the token’s performance within the Bollinger Bands and its ability to breach key resistance levels highlight its potential for further gains. Traders should watch for the $1.2-$1.3 resistance zone and monitor trading volume to gauge the strength of the bullish trend.
Jupiter's journey from its recent lows to its current position showcases its resilience and potential for future growth. As the market evolves, JUP's ability to maintain its support levels and breach new resistance points will be critical to its continued success.


